What Is Price Action?
The price movements to identify trading opportunities
What Is Price Action?
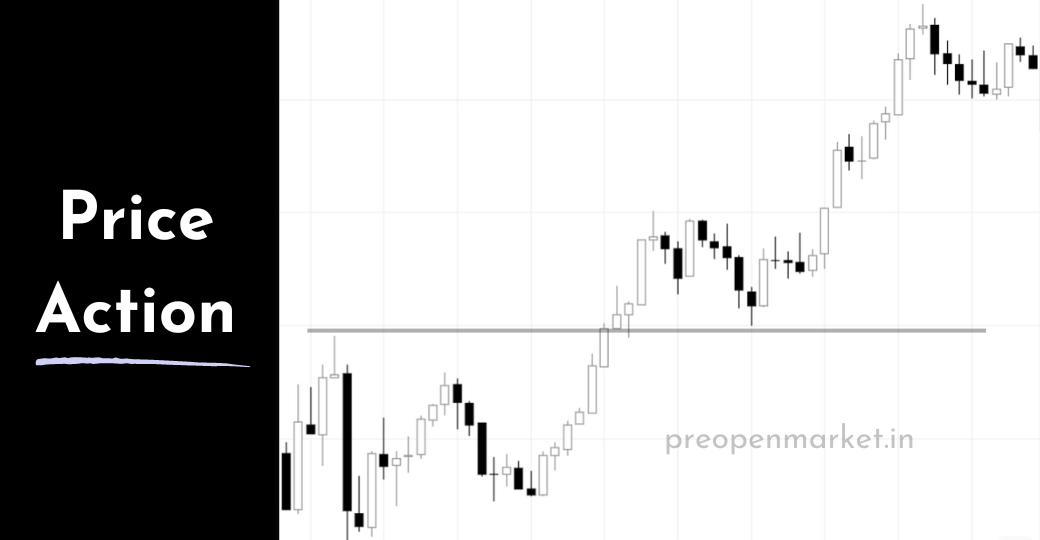
Price action refers to the movement and behavior of a financial asset's price on a price chart, typically in the context of trading and technical analysis. Traders and analysts use price action to make informed decisions about buying or selling assets, without relying heavily on indicators or other external factors. It involves interpreting the patterns, trends, and formations that emerge from the price movements themselves. Price action trading is often employed in various financial markets, such as stocks, forex, commodities, and cryptocurrencies.
Let's look at the key topics to understand price action:
-
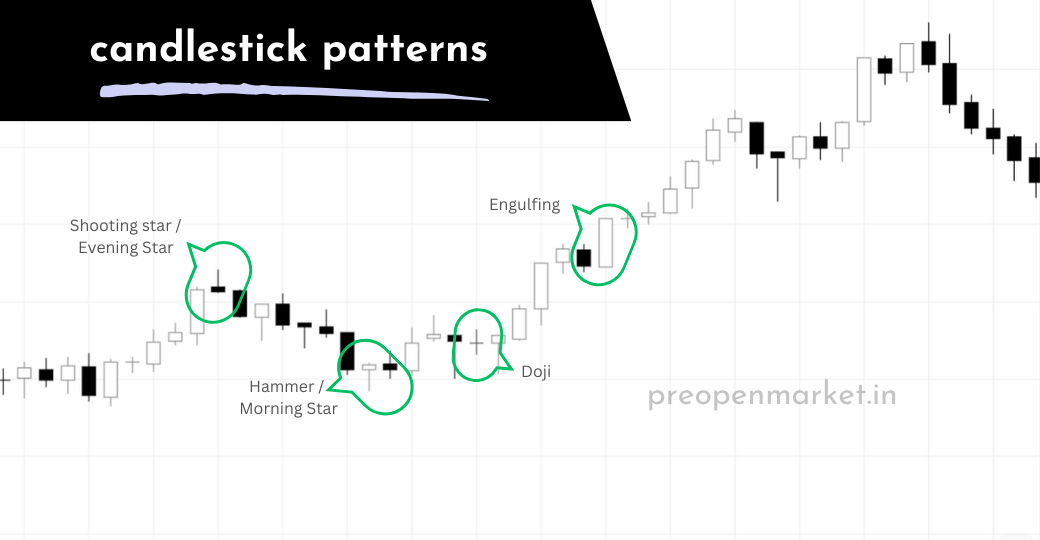
Candlestick Patterns:
- Candlesticks are graphical representations of price movement during a specific time period (e.g., one minute, one hour, one day).
- Different candlestick patterns, such as doji, engulfing, hammer, and shooting star, provide insights into potential shifts in market sentiment.
- Traders analyze these patterns to anticipate potential reversals or continuations in price trends.
-
Support and Resistance:
- Support levels are price points where a financial asset historically has had difficulty falling below, indicating potential buying interest.
- Resistance levels are price points where an asset has struggled to rise above, suggesting potential selling pressure.
- Identifying and analyzing support and resistance levels helps traders anticipate potential price reversals or breakouts.
-
Trends and Trendlines:
- A trend is the general direction in which an asset's price is moving over a specified time frame, such as uptrend (rising prices) or downtrend (falling prices).
- Trendlines are drawn on price charts to connect successive lows or highs, aiding in identifying and confirming trends.
- Traders seek to trade in the direction of the prevailing trend to maximize potential profits.
-
Chart Patterns:
- Chart patterns, such as head and shoulders, double tops, and triangles, form as prices move and consolidate.
- These patterns provide insights into potential future price movements based on historical price behavior.
- Recognizing and interpreting chart patterns helps traders make predictions about future price directions.
-
Price Action Trading Strategies:
- Price action trading strategies involve making trading decisions based primarily on the analysis of price movements.
- Traders may use techniques like breakout trading, pullback trading, and trend continuation strategies.
- These strategies often involve placing trades based on key price levels, patterns, and trend dynamics.
-
Volume Analysis:
- Volume refers to the number of shares or contracts traded in a specific time period.
- Analyzing volume alongside price action can provide insights into the strength or weakness of price movements.
- Increased volume during a price movement may indicate higher conviction among traders.
-
Risk Management:
- Effective price action trading also involves managing risk through techniques such as setting stop-loss orders and position sizing.
- Traders use price action analysis to determine optimal entry and exit points for minimizing potential losses.
Price action analysis requires practice and experience to become proficient. Traders often combine price action with other technical or fundamental analysis tools to make well-informed trading decisions. It emphasizes understanding market psychology and interpreting the behavior of market participants based on the price movements alone.
Here are some additional tips for learning price action:
- Start with a demo account: Before you start trading with real money, it is important to practice on a demo account. This will allow you to learn how to identify price action patterns and to develop your trading skills without risking any money.
- Study the charts: The best way to learn price action is to study the charts. Look for patterns, support and resistance levels, and trends. The more you study the charts, the better you will become at identifying trading opportunities.
- Read books and articles: There are many books and articles that can teach you about price action. Read as much as you can to learn as much as you can about this trading methodology.
- Join a trading community: There are many trading communities online where you can ask questions, learn from other traders, and share your own trading experiences. Joining a trading community can be a great way to learn price action and to improve your trading skills.
Price Action Trading Strategies And Patterns
Price action trading strategies involve identifying and interpreting patterns in price movements to make trading decisions. Here are some common price action patterns and the strategies associated with them:
-
Pin Bar (Pinocchio Bar) Reversal:
- A pin bar is a candlestick pattern with a long wick (or "tail") and a small body, resembling a pinocchio's nose.
- It indicates a potential reversal in the market sentiment.
- Strategy: Traders look for pin bars at key support or resistance levels to signal potential reversals. A bullish pin bar near support suggests a potential price rise, while a bearish pin bar near resistance indicates a potential decline.
-
Engulfing Candlestick Pattern:
- An engulfing pattern occurs when a larger candle fully engulfs the previous smaller candle, indicating a potential trend reversal.
- Strategy: Traders watch for bullish engulfing patterns at the end of downtrends and bearish engulfing patterns at the end of uptrends to anticipate reversals.
-
Inside Bar Pattern:
- An inside bar forms when the range (high to low) of a candle is within the range of the previous candle.
- It suggests consolidation and potential breakout.
- Strategy: Traders identify inside bars and wait for a breakout in the direction of the prevailing trend. Breakouts can lead to strong price movements.
-
Double Top and Double Bottom:
- A double top pattern occurs when an asset forms two consecutive peaks at approximately the same price level, signaling a potential reversal from an uptrend to a downtrend.
- A double bottom pattern occurs when an asset forms two consecutive troughs at approximately the same price level, signaling a potential reversal from a downtrend to an uptrend.
- Strategy: Traders wait for confirmation of the reversal after the pattern is complete. A breakout below the double bottom neckline or above the double top neckline confirms the pattern.
-
Head and Shoulders Pattern:
- This pattern consists of three peaks: a higher peak (head) between two lower peaks (shoulders).
- It indicates a potential trend reversal from uptrend to downtrend.
- Strategy: Traders wait for the pattern to complete and then look for a breakdown below the neckline to confirm the reversal.
-
Trendline Breakout:
- Trendlines connect a series of higher lows in an uptrend or lower highs in a downtrend.
- A trendline breakout suggests a potential change in trend direction.
- Strategy: Traders look for a decisive breakout above a downtrend trendline or below an uptrend trendline to enter trades in the new direction.
-
Bullish and Bearish Flags:
- A bullish flag is a continuation pattern that forms after a strong price uptrend, indicating a brief consolidation before resuming the uptrend.
- A bearish flag is a continuation pattern that forms after a strong price downtrend, indicating a brief consolidation before resuming the downtrend.
- Strategy: Traders wait for the flag pattern to complete and then enter trades in the direction of the prevailing trend when the price breaks out of the flag.
These are just a few examples of price action trading strategies based on patterns. Traders often combine multiple patterns and factors to make well-informed decisions. It's important to remember that no pattern guarantees a specific outcome, and risk management should always be a priority when implementing any trading strategy.
Price Action Entry Rules
Price action entry rules are a set of guidelines that traders use to determine when to enter a trade based on the price action of the market. These rules can be used to trade a variety of assets, including stocks, currencies, and commodities.
There are many different price action entry rules, but some of the most common include:
- Breakouts: A breakout occurs when the price of an asset moves above or below a key level of support or resistance. This can be a signal that the trend is about to change, and traders can enter a trade in the direction of the breakout.
- Reversal candlestick patterns: Reversal candlestick patterns are candlestick patterns that indicate a change in trend. Some popular reversal candlestick patterns include the hammer, the engulfing pattern, and the shooting star.
- Moving averages: Moving averages are trend-following indicators that can be used to identify support and resistance levels. Traders can enter a trade when the price of an asset crosses above or below a moving average.
- Fibonacci retracements: Fibonacci retracements are levels of support and resistance that are calculated based on the Fibonacci sequence. Traders can enter a trade when the price of an asset retraces to a Fibonacci retracement level.
It is important to note that price action entry rules are not always foolproof. The market can often move in unpredictable ways, and even the best price action traders will experience losses. However, by following a set of well-defined rules, traders can increase their chances of success.
Here are some additional tips for using price action entry rules:
- Use multiple rules: It is best to use multiple price action rules to confirm a trade signal. This will help to reduce the risk of false signals.
- Use a stop loss: Always use a stop loss to limit your losses in case the trade goes against you.
- Be patient: Don't enter a trade just because a price action rule is triggered. Wait for a good opportunity to enter a trade.
- Practice on a demo account: Before you start trading with real money, it is important to practice on a demo account. This will allow you to learn how to use the price action entry rules and to develop your trading skills.