Japanese candlestick pattern
A visual representation of the price action
Introduction to Japanese Candlestick Patterns
A Japanese candlestick pattern is a graphical representation of price movements in financial markets, commonly used in technical analysis to predict potential price reversals, trends, and market sentiment. These patterns originated in Japan during the 17th century and were originally used to analyze rice trading. Today, they are widely used across various financial markets, including stocks, forex, commodities, and cryptocurrencies.
Each candlestick on a chart represents a specific time period, such as a minute, an hour, a day, or a week. The candlestick displays four key price points: the opening price, the closing price, the highest price (high), and the lowest price (low) during that time period.
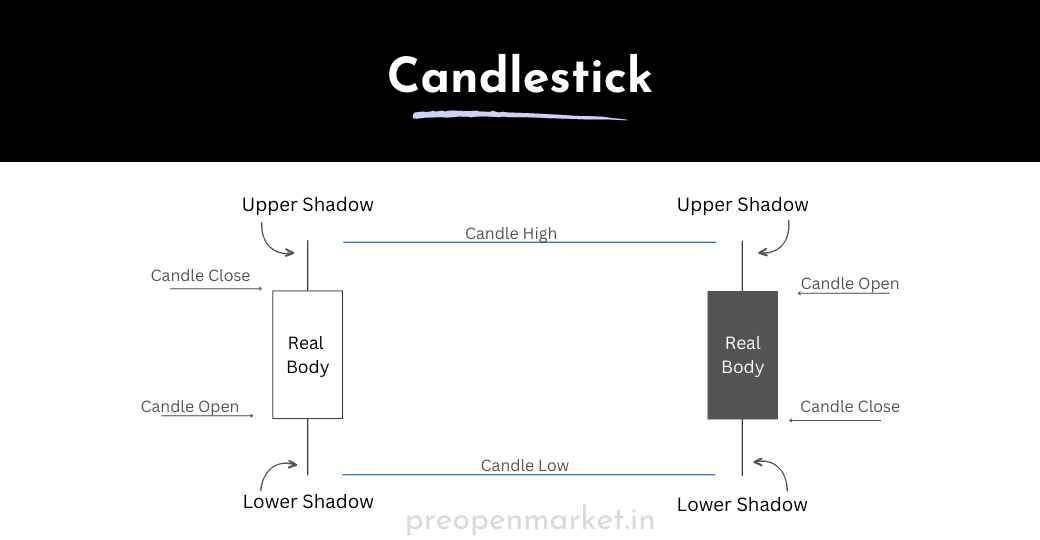
A Japanese candlestick consists of two main parts:
-
The Body: The rectangular area between the opening and closing prices is called the "body" of the candlestick. It can be filled (colored) or hollow (white or clear), representing different types of price movements.
-
The Wick (Shadow): The thin lines above and below the body are known as the "wick" or "shadow." The upper wick extends from the top of the body to the high price, while the lower wick extends from the bottom of the body to the low price.
Japanese candlestick patterns can be broadly categorized into two types:
-
Reversal Patterns: These patterns suggest potential reversals in the current price trend. They include formations like doji, hammer, shooting star, engulfing patterns (bullish and bearish), and evening star/morning star.
-
Continuation Patterns: These patterns indicate that the prevailing trend is likely to continue. Examples include the bullish and bearish flag patterns, pennants, and symmetrical triangles.
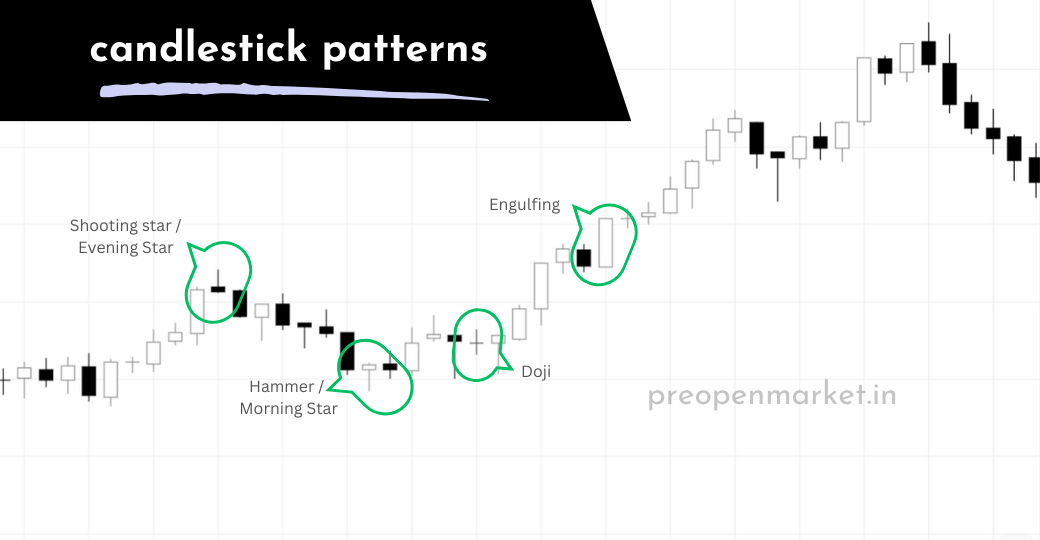
Here are a few common Japanese candlestick patterns:
-
Doji: A doji occurs when the open and close prices are very close or equal, resulting in a small or non-existent body. It suggests indecision in the market and potential trend reversal.
-
Hammer: A hammer has a small body near the high and a long lower wick. It indicates potential bullish reversal after a downtrend.
-
Shooting Star: The shooting star has a small body near the low and a long upper wick. It suggests potential bearish reversal after an uptrend.
-
Engulfing Patterns: Bullish engulfing patterns occur when a small bearish candle is followed by a larger bullish candle. Bearish engulfing patterns are the opposite. They signal potential reversals.
-
Morning Star and Evening Star: These three-candle patterns indicate potential reversals. The morning star forms after a downtrend, while the evening star forms after an uptrend.
-
Bullish and Bearish Flags: These patterns form after a strong price movement (flagpole) and suggest brief consolidation before the trend resumes.
Japanese candlestick patterns are valuable tools for traders and analysts to assess market psychology and make informed trading decisions. However, like all technical analysis tools, they are not foolproof and should be used in conjunction with other forms of analysis and risk management techniques.
Candlestick patterns can be used to identify potential trading opportunities and to confirm price action signals. However, it is important to remember that candlestick patterns are not always reliable and should not be used as the sole basis for making trading decisions.
It is also important to note that there are many different interpretations for candlestick patterns. Some traders may interpret a certain pattern as a bullish signal, while others may interpret it as a bearish signal. It is important to develop your own understanding of candlestick patterns and to use them in conjunction with other technical analysis tools.
Candlestick Chart
A candlestick chart is a popular type of financial chart used in technical analysis to visualize price movements of an asset over a specific time period. It provides a clear and detailed representation of an asset's open, high, low, and close prices within a defined interval, such as minutes, hours, days, weeks, or months. Candlestick charts originated in Japan and have become widely adopted by traders and analysts around the world.
The color of the candlestick provides visual cues about the price movement. A bullish candle (price increased) is typically white or green, while a bearish candle (price decreased) is red or black.
Candlestick charts provide valuable insights into market sentiment and help traders make informed decisions. They are often used in combination with other technical analysis tools and indicators to develop trading strategies. While candlestick patterns can offer useful information, it's important to remember that no single pattern guarantees a specific outcome, and thorough analysis and risk management are essential.