The Simplest Trading Strategy in the World
Simple strategies executed well lead to trading success
The Simplest Trading Strategy in the World
One of the most straightforward and potent trading strategies globally involves simply trading price action signals originating from horizontal levels displayed on a price chart. If there's only one takeaway you get from this platform, let it be this: seek evident price action patterns emerging at crucial horizontal levels within the market.
By adhering to this fundamental 'recipe,' you'll come across numerous trading opportunities with a high likelihood of success throughout a year's span. Refrain from overcomplicating the process of market analysis and trade identification. The market will naturally present signals when the time is right; your task is to grasp the appearance of these signals and their specific locations. This is precisely what you'll gain insights into in the upcoming sections...
Success = Price action signals + Horizontal (Support/Resistance) levels
The sequence of discovery, whether it's the price action signal or the level, holds little significance. What truly matters is their convergence, resulting in a confluence of price action conducive to a trade. When an unmistakable price action signal, such as a pin bar or fakey pattern, materializes at a significant horizontal support or resistance level within the market, a trade with substantial potential probability emerges.
Horizontal support or resistance levels represent zones or points on the chart from which price initiated a pronounced upward or downward movement. These levels can be effectively applied in diverse market scenarios: trending, counter-trend, or trading ranges. The focal point of our current lesson revolves around identifying a distinct price action signal harmonizing with a crucial chart level. These levels possess a magnet-like quality, drawing price toward them before propelling it in the opposite direction. They also encapsulate the concept of 'value areas,' representing zones where price established 'fair value,' typically preceding another forceful market move.
Now let's examine some real chart examples that demonstrate trading price action signals from significant horizontal levels:
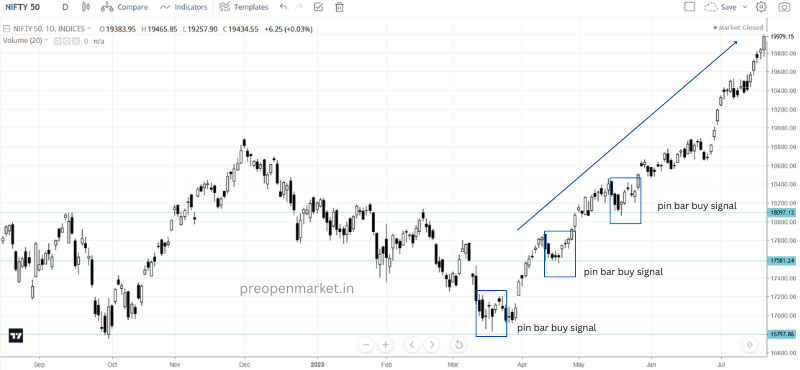
This NIFTY chart provides an excellent example of a pin bar reversal pattern forming at a key horizontal level. The 16797 price level was already an identified area of significance that traders should have marked prior. All that was needed then was waiting patiently for a signal to develop near this zone.
We can observe a precise pin bar forming right at 16800, rejecting this major level. The pin bar indicates buyers stepping in as price tests support. This price action signals a high-probability long setup with the pin bar lows defining risk parameters.
In summary, when we combine a clear signal like this pin bar with pre-existing horizontal support, it creates optimal conditions to enter long. The market has validated this precise area as significant by the price rejection. Just identify the level, anticipate the signal formation, then execute with definition of risk and target.
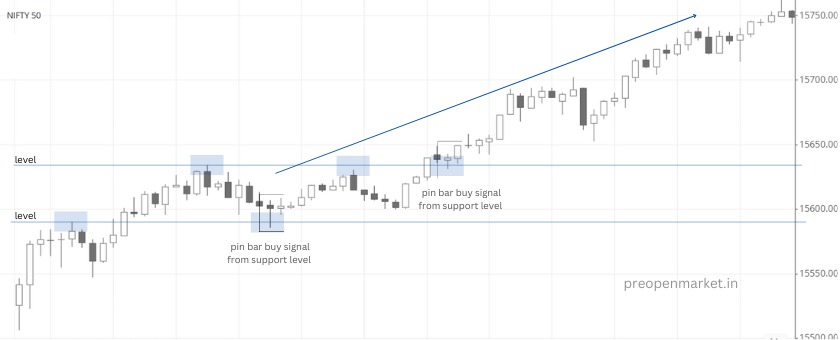
The subsequent illustration showcases a buying signal in the form of a pin bar, which materialized at a pivotal support level on the price chart within an ongoing uptrend. When a price action signal aligns with both a prevailing trend and a significant level, it constitutes a trade setup of exceptional quality. A prime exemplar of this synergy is demonstrated in the following instance, observed on the daily NIFTY chart. In this scenario, an uptrend was evident, coinciding with a notable horizontal support level situated around 15590. Subsequently, an immaculately defined and "perfect" pin bar trading strategy emerged at this juncture. The outcome was remarkable, as the trend promptly resumed on the very next day after the pin bar's appearance, propelling the price further upward.
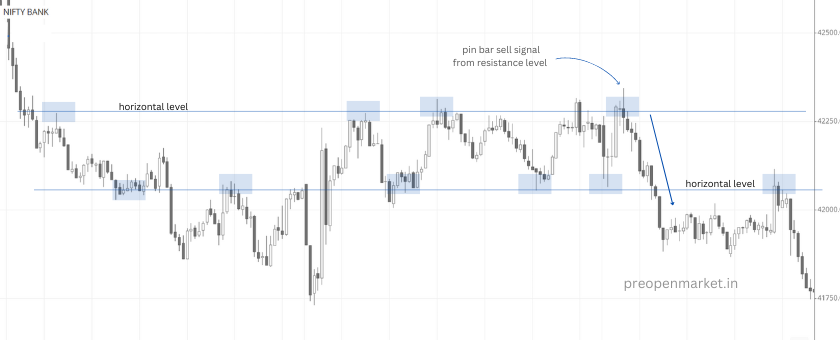
In the presented chart, the BANKNIFTY exhibited substantial oscillation within an extensive range, alternating between distinct horizontal support and resistance levels. When confronted with such circumstances of a market bound within a range, our attention is directed towards the extremities of this range, represented by the support and resistance levels. These levels hold the potential to yield opportune moments for either purchasing or selling based on price action signals. A vivid instance of this concept materialized in the chart below, where a conspicuous pin bar sell signal emerged precisely at the horizontal resistance point within this trading range. This signal acted as a trigger for a significant downward movement, ultimately propelling the price toward the lower boundary of the range...
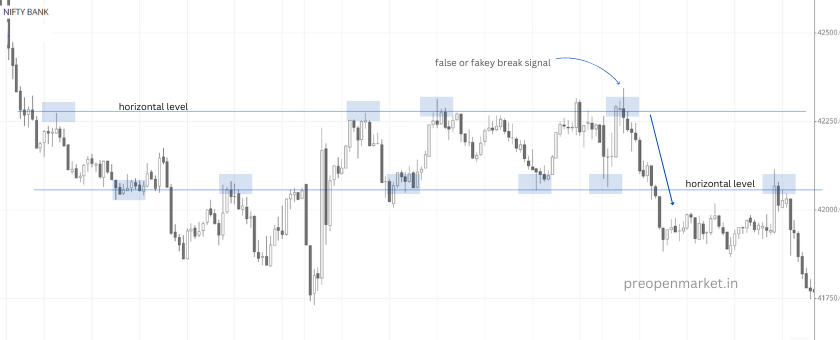
Lastly, let's examine a counter-trend illustration of trading price action signals occurring at crucial horizontal levels within the market's structure. Displayed here is the daily chart for BANKNIFTY, where a remarkably evident fakey trading strategy materialized precisely at a significant resistance level of around 42250. This fakey pattern signified a notable rejection and a deceptive breach of the aforementioned level, signaling a depletion of bullish momentum and the potential for a downward price movement in the near future. Subsequently, as anticipated, the price did indeed experience a decline subsequent to the emergence of the fakey signal, and this decline extended significantly over the ensuing days. Once again, this serves as a compelling demonstration of the effectiveness inherent in trading price action signals at critical horizontal levels within the market.
The core essence of this tutorial is straightforward: A complex or perplexing trading strategy is not a prerequisite for identifying high-probability entry points in a market. What's necessary is the skill to identify price action trading patterns occurring at pivotal chart levels of horizontal support and resistance. By dedicating your efforts to mastering this singular strategy, you'll acquire the capability to analyze charts across various markets and uncover promising high-probability price action trading prospects.
I trust you found value in this tutorial introducing the world's simplest trading strategy. To delve deeper into the subject, explore the comprehensive resources available at the Price Action Trading University.