Price Action Reversal Strategies
A signal that the trend is about to change
Price Action Reversal Strategies
Price action reversal strategies are trading approaches that focus on identifying potential trend reversals based on patterns and price movements in the market. Traders using these strategies seek to anticipate changes in the prevailing trend and enter trades with the expectation that the price will reverse direction. Here are some common price action reversal strategies:
-
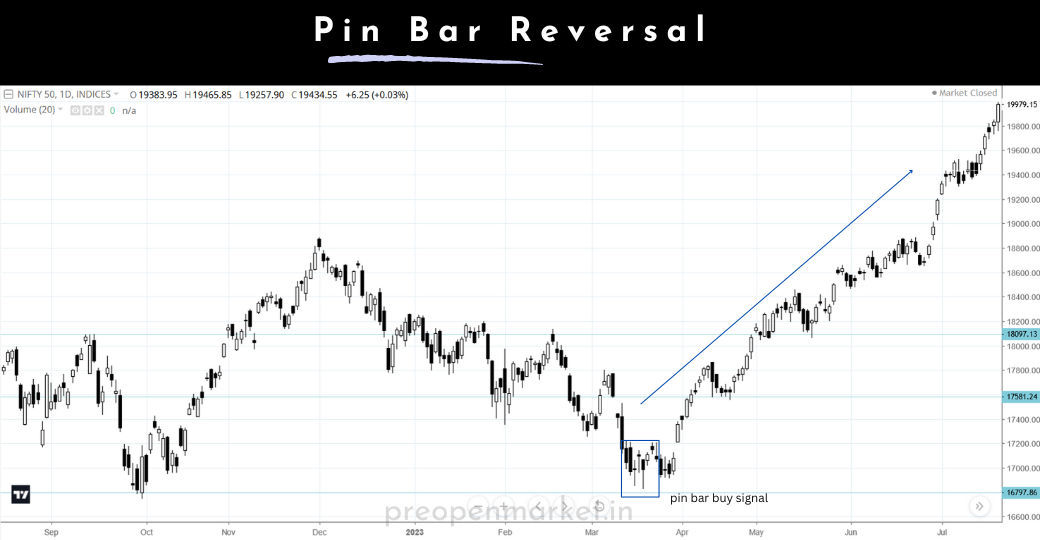
Pin Bar Reversal:
- As mentioned earlier, a pin bar is a candlestick pattern with a long wick and a small body.
- In a pin bar reversal strategy, traders look for a pin bar formation at key support or resistance levels.
- A bullish pin bar near support suggests a potential upward reversal, while a bearish pin bar near resistance indicates a potential downward reversal.
-
Engulfing Candlestick Reversal:
- An engulfing pattern involves a larger candle completely engulfing the previous smaller candle.
- Traders watch for bullish engulfing patterns at the end of downtrends and bearish engulfing patterns at the end of uptrends.
- These patterns signal potential trend reversals.
-
Double Top and Double Bottom Reversals:
- A double top pattern (two consecutive peaks) signals a potential reversal from an uptrend to a downtrend.
- A double bottom pattern (two consecutive troughs) suggests a potential reversal from a downtrend to an uptrend.
- Traders wait for confirmation through neckline breakouts.
-
Head and Shoulders Reversal:
- The head and shoulders pattern consists of three peaks: a higher peak (head) between two lower peaks (shoulders).
- This pattern signals a potential reversal from an uptrend to a downtrend.
- Traders look for a breakdown below the neckline to confirm the reversal.
-
Falling Wedge and Rising Wedge Reversals:
- Falling wedge patterns are bullish and form during downtrends, while rising wedges are bearish and develop during uptrends.
- These wedge patterns indicate potential reversals.
- Traders watch for breakouts in the direction opposite to the prevailing trend.
-
Divergence Reversals:
- Divergence occurs when the price moves in the opposite direction of a technical indicator, such as the Relative Strength Index (RSI) or Moving Average Convergence Divergence (MACD).
- Bullish divergence suggests a potential upward reversal, while bearish divergence indicates a potential downward reversal.
- Traders use divergence to anticipate trend changes.
-
Trendline Breakout Reversals:
- Trendlines connecting price highs or lows can indicate potential reversals.
- Traders watch for a decisive breakout above a downtrend trendline or below an uptrend trendline to signal a reversal.
-
Support and Resistance Reversals:
- When price breaks through a significant support level in a downtrend or resistance level in an uptrend, it can signal a reversal.
- Traders look for these breaks to confirm potential trend reversals.

It's important to note that price action reversal strategies require careful analysis and confirmation before entering trades. False signals can occur, and risk management is crucial to protect against potential losses. Traders often combine price action reversal strategies with other technical analysis tools and indicators to increase the probability of successful trades.
Here are some additional tips for using price action reversal strategies:
- Use multiple time frames: It is best to use multiple time frames to confirm price action signals. This will help to reduce the risk of false signals.
- Use a stop loss: Always use a stop loss to limit your losses in case the trade goes against you.
- Be patient: Don't enter a trade just because a price action signal is triggered. Wait for a good opportunity to enter a trade.
- Practice on a demo account: Before you start trading with real money, it is important to practice on a demo account. This will allow you to learn how to use the price action techniques and to develop your trading skills.


