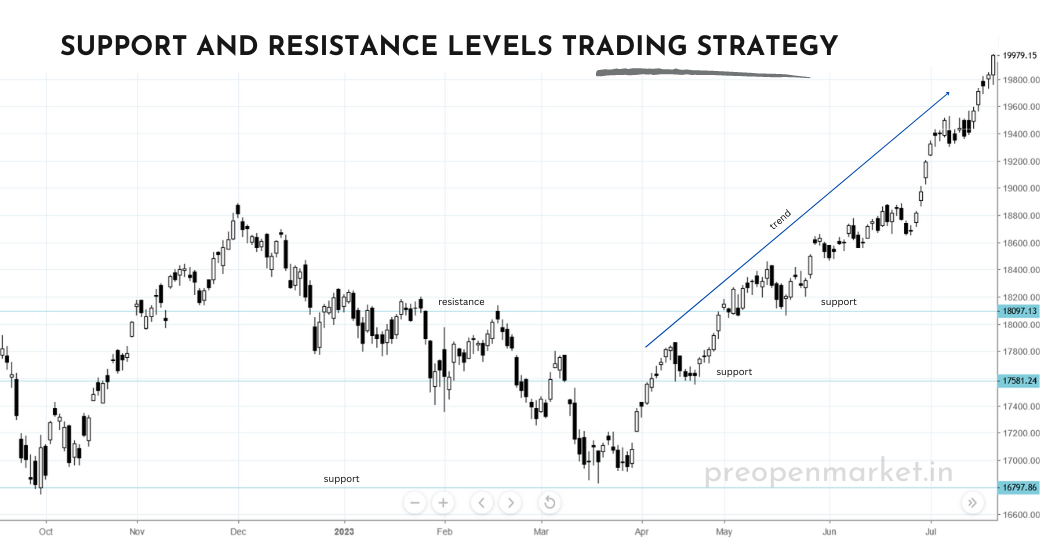
Support and Resistance Levels Trading Strategy
Using potential reversals in the price trend

Support and Resistance Levels Trading Strategy
The Support and Resistance Levels Trading Strategy is a fundamental approach used by traders to identify potential entry and exit points in the financial markets. This strategy is based on the concepts of support and resistance, which are critical price levels where the market has historically shown a tendency to reverse or stall.
What are Support and Resistance Levels in Trading?
Support and resistance are key levels on a price chart that act as potential reversal points in the market.
Support is a level where downward price movement is halted and the price bounces back up from. It indicates buying pressure and market demand. Key support levels are formed at:
- Previous swing lows
- Moving averages
- Trendlines
- Fibonacci retracements
Resistance is the opposite of support. It is a level where upward price movement stalls and reverses back down from. Resistance indicates selling pressure and supply. Key resistance levels are typically:
- Previous swing highs
- Moving averages
- Trendlines
- Fibonacci retracements
Traders watch price action at support and resistance levels to see if they will hold and lead to a bounce (acting as reversal points), or if they will break, potentially leading to a continued move (breakout).
Support and resistance trading involves buying near support and selling near resistance. Stop losses are placed below support on long trades, and above resistance on short trades.
Proper analysis of support and resistance levels provides traders with high probability reversal and breakout trade entry points. These key levels are at the core of many trading strategies.
Support and Resistance Levels Trading Strategy
Traders use support and resistance levels to identify potential reversals in the price trend. When the price reaches a support level, it is often interpreted as a sign that the downtrend is slowing down or reversing. When the price reaches a resistance level, it is often interpreted as a sign that the uptrend is slowing down or reversing.
Here's how the Support and Resistance Levels Trading Strategy works:
1. Support Level: A support level is a price level where the market has historically found buying interest, preventing the price from falling further. It acts as a floor that supports the price from declining.
2. Resistance Level: A resistance level is a price level where the market has historically encountered selling interest, preventing the price from rising higher. It acts as a ceiling that resists upward price movement.
3. Identification of Levels: Traders identify support and resistance levels by analyzing historical price data, chart patterns, and technical indicators. These levels can be horizontal lines drawn on a price chart.
4. Trading Signals: Once support or resistance levels are identified, traders look for trading signals that indicate potential price movements. For example:
- When the price approaches a support level, traders may look for signs of a potential bounce or reversal.
- When the price approaches a resistance level, traders may watch for indications of a potential pullback or reversal.
5. Entry and Stop Loss: Traders typically enter trades near support levels in anticipation of a bounce, or near resistance levels in anticipation of a reversal. Stop-loss orders are often placed beyond the support or resistance level to manage risk.
6. Target and Risk Management: Profit targets can be set based on technical factors such as the distance between support and resistance levels, previous price swings, or chart patterns. Risk management techniques, such as using a favorable risk-to-reward ratio, help manage potential losses.
7. Confirmation and Additional Factors: Traders often enhance their analysis by considering additional factors such as candlestick patterns, trendlines, and other technical indicators that provide confirmation of potential price movements.
8. Trade Continuation or Reversal: Support and resistance levels can also be used to identify potential trend continuation patterns, where the price bounces off support in an uptrend or resistance in a downtrend.
9. Practice and Experience: Like any trading strategy, practice and experience are crucial. Traders should test the strategy on historical data and practice in a demo trading environment before applying it to real-money trading.
It's important to note that while support and resistance levels can provide valuable trade signals, not every trade will result in a successful outcome. Traders should exercise caution, use proper risk management, and consider the overall market context when applying the Support and Resistance Levels Trading Strategy.


