False Breakout Trading Strategy
best traded in the direction of the trend
False Breakout Trading Strategy
- What is a false breakout?
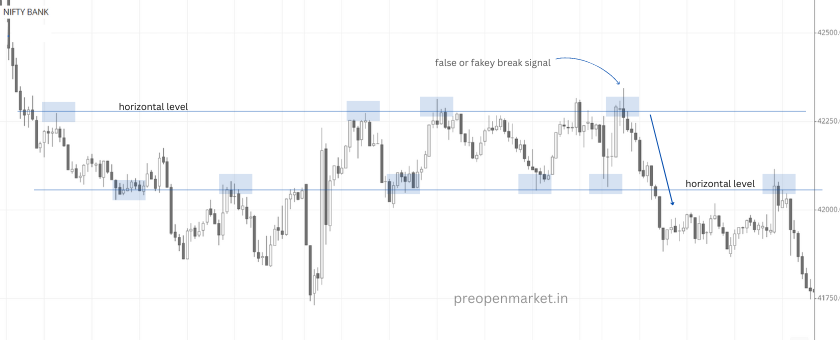
A false breakout is a price movement that exceeds a support or resistance level, but then quickly reverses and returns to the previous range. False breakouts can be caused by a variety of factors, such as: * Short-covering: When traders who are short a security buy it back to close out their position, it can cause a temporary price increase that exceeds the support level. * Stop-loss hunting: Traders who place stop losses below a support level can be targeted by other traders who sell into the stop losses, causing the price to fall below the support level. * Fakeout: A fakeout is a deliberate attempt by large traders to mislead other traders into thinking that a breakout has occurred.
- How to identify false breakouts?
There are a number of factors that can help you identify false breakouts, such as: * Volume: If the volume is low on the breakout, it is more likely to be false. This is because low volume indicates that there is not enough buying or selling pressure to sustain the breakout. * Reversal candlestick pattern: If a reversal candlestick pattern forms after the breakout, it is more likely to be false. Reversal candlestick patterns are patterns that indicate a change in trend. * Retest of the breakout level: If the price retests the breakout level and fails to break through it, it is more likely to be false. This is because a retest indicates that the market is not yet convinced that the breakout is real.
- How to trade false breakouts?
There are a number of ways to trade false breakouts, such as: * Short selling: If you believe that a breakout is false, you can short sell the security at the breakout point. This means that you sell the security with the expectation that it will fall in price. * Buying puts: If you believe that a breakout is false, you can buy puts on the security. Puts are options that give you the right to sell the security at a specific price in the future. This means that you can profit if the security falls in price. * Waiting for confirmation: If you are not sure whether a breakout is false, you can wait for confirmation before entering a trade. This means waiting for the breakout to be confirmed by volume and candlestick patterns.
- Risks of trading false breakouts
There are a number of risks associated with trading false breakouts, such as: * Losing money: If you enter a trade on a false breakout, you could lose money. This is because the price could reverse and move in the opposite direction of your trade. * Getting stopped out: If you use a stop loss to limit your losses, you could still get stopped out on a false breakout. This is because the stop loss could be triggered by the initial breakout, even though it is false. * Missing out on a real breakout: If you wait for confirmation before entering a trade, you could miss out on a real breakout. This is because the real breakout could occur before you have a chance to enter a trade.
- Tips for avoiding false breakouts
Here are some tips for avoiding false breakouts: * Use a high-quality charting platform: A good charting platform will allow you to see the volume and candlestick patterns that can help you identify false breakouts. * Set stop losses: Always use stop losses to limit losses in case the breakout is not false. * Be patient: Don't enter a trade just because there is a breakout. Wait for the breakout to be confirmed by volume and candlestick patterns. * Trade with the trend: The false breakout trading strategy is most effective when used in the direction of the trend.